INS 6.2 Interpret the signal quality distribution
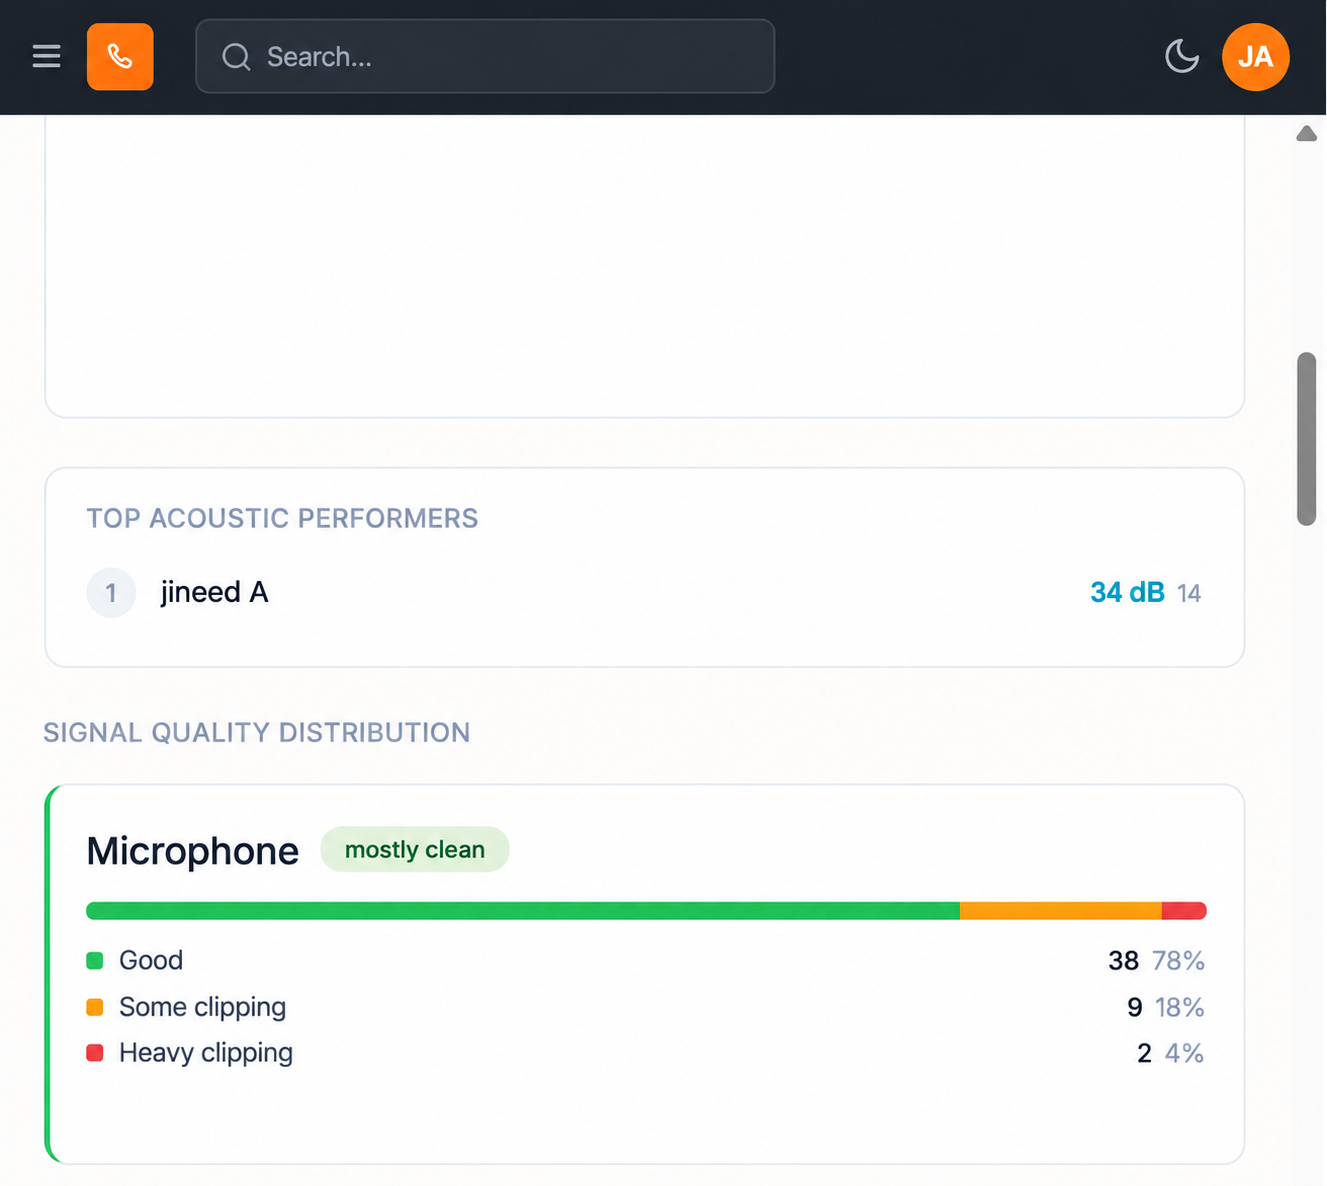
Four categories, each grouping calls into three bands:
| Category | Bands |
|---|---|
| Microphone | Good, Some clipping, Heavy clipping |
| Echo | Borrar, Mild, Strong |
| Volverground | Quiet, Office noise, Loud |
| Line quality | HD voice, Standard, Narrow band |
Each band shows a count and a percentage.
Read the count and the percentage together. A category showing 30 per cent in its worst band matters very differently across twenty calls and across two thousand. The percentage tells you how widespread the issue is; the count tells you whether it is worth a project.
The four categories point at four different owners. Microphone and Volverground are the agent's headset and room. Echo is usually a device or an acoustic path. Line quality is the network or the carrier. Prioritise the one with the largest count in its worst band, and route it to the team that can actually fix it.